sqlCharts is built into sqlReports and allows one to turn a sqlReport into a variety of charts without having to do any chart coding. Charts can be single series, such as a pie chart, or multi-series, which compares multiple items, such as a column chart with different grade levels. There are 27 different charts to choose from:
Creating a Chart
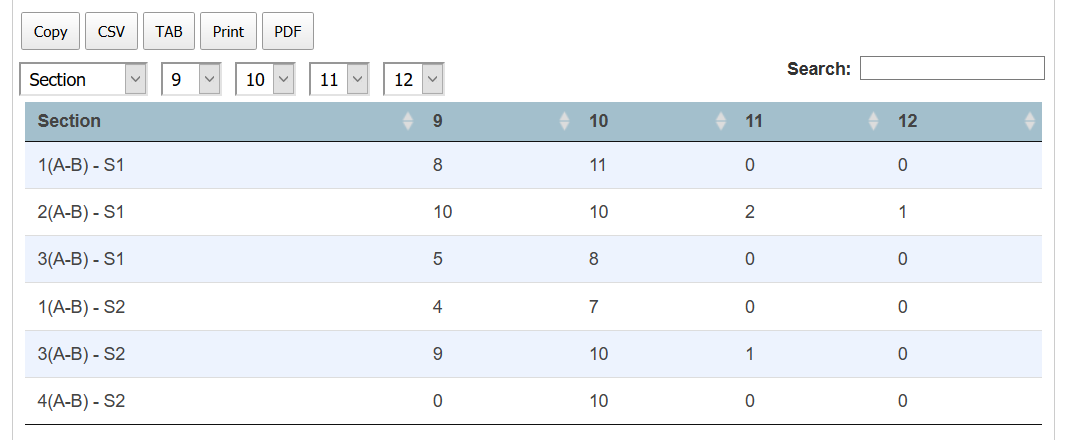
To create a chart, one just needs to have a sqlReport that has labels in the first column, and numbers in the second or third or more columns. A report with only two columns can create a single series chart, such as a pie chart, while a report with more than two columns can create multi-series charts. One creates the report like a regular sqlReport to verify data appears correctly. Below is the output for the Course Totals by Grade Level enrollment report on this site:

Once the report is returning valid data as a regular report like above, it can be changed to run as a chart report. Users will still see the page where they enter report parameters first, but once they click submit, instead of seeing a tabular report like above, a page with chart parameters will appear:
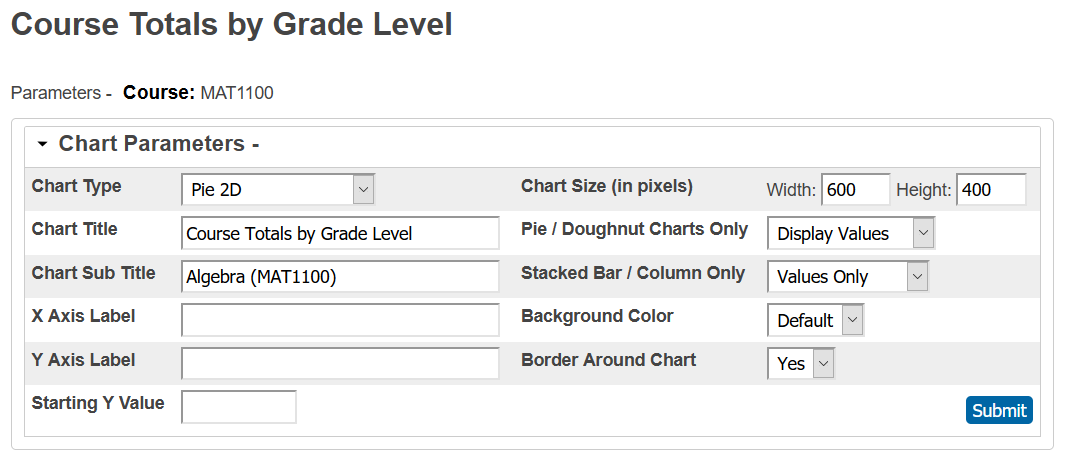
The user can choose different chart types and change any of the other parameters. A chart will appear below those parameters once the Submit button is clicked:

The user could choose a different chart or change some parameters, and then click the Submit button again to get an updated chart. Once the user has the chart they want, they can copy the chart to the clipboard for use elsewhere.
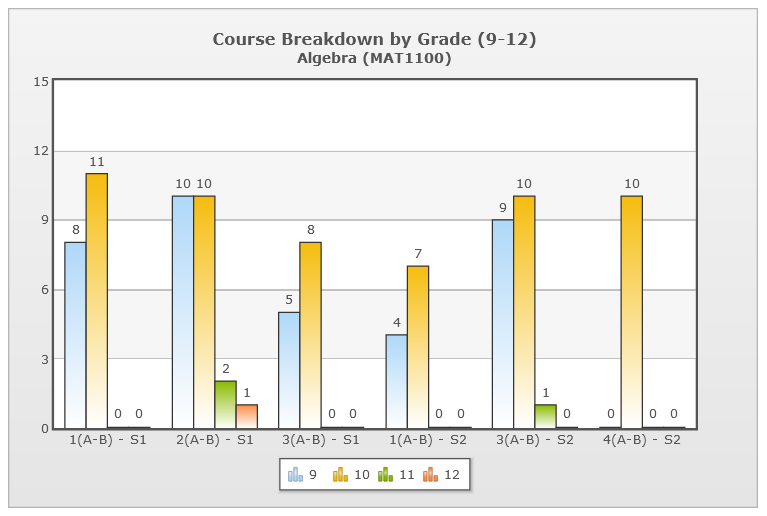
The chart above is a single series chart, which is a chart with only one column of data being charted, such as the total count of students enrolled in a course. sqlCharts can also create multi-series charts, which are charts with multiple columns of data, such as the breakdown of enrollments in different sections of the course. Below is the output for the Course Breakdown by Grade (9-12) enrollment report on this site:
One can then choose a multi-series chart to chart the data, with a legend at the bottom of the chart explaining the colors:
Advantages to Using sqlCharts:
- No Need to Know How to Code Charts - the user running the report just has to do is pick the chart type and other parameters in order to create a chart.
- It's Available for Admins or Teachers - you can create charts for admins or teachers to use. Since it's part of sqlReports, it's available for them to view right in the portal.